Improving low-resolution models via parameterisation of the effect of submesoscale vertical advection on temperature: A case study in the East China Sea
Date of Issue:2022-04-12
Reading:1318
Xuan J., Su J., Wang H., Huang D., Ding R., Zhou F., Mayer B., Pohlmann T. 2019. Improving low-resolution models via parameterisation of the effect of submesoscale vertical advection on temperature: A case study in the East China Sea. Ocean Modelling. DOI: 10.1016/j.ocemod.2019.03.002.
Horizontal resolutions of regional ocean models are often inadequate to resolve submesoscale vertical advection (SVA) in the continental shelf seas. This study aims to compare the SVA in two similar model setups in the East China Sea with different horizontal resolutions. A novel method to parameterise the impact of SVA on temperature (SVA-T) has also been proposed, which can significantly improve the low-resolution model (LRM) results. In particular, we focus on the time frame wherein this method can be applied. The suggested method primarily improves the representation of an internal warming process, which is significant in both the observations and high-resolution model (HRM) but is absent in the original LRM. Combined with the observations, we found that the internal warming, which occurred in the barrier layer of the water column during early autumn, is accompanied by submesoscale oscillations of isothermals in the HRM. SVA dominates the internal warming process and increases the total vertical advection by up to an order of magnitude in the HRM compared with the LRM. Therefore, we parameterised SVA-T by increasing the vertical thermal diffusion coefficient in the LRM.
To further specify the time frame wherein the parameterisation can be applied, we introduced two empirical conditions related to the major generation mechanisms of frontogenesis, mixed-layer instabilities and turbulent thermal wind in the mixed layer: a deep mixed-layer depth > 20 m and a large surface-bottom temperature difference (∆T > 2 °C). Finally, we successfully simulated the internal warming in the LRM during early autumn by applying the proposed method. Nevertheless, the parameterisation of the horizontal distribution of SVA-T needs to be considered in the future to achieve better three-dimensional model results.
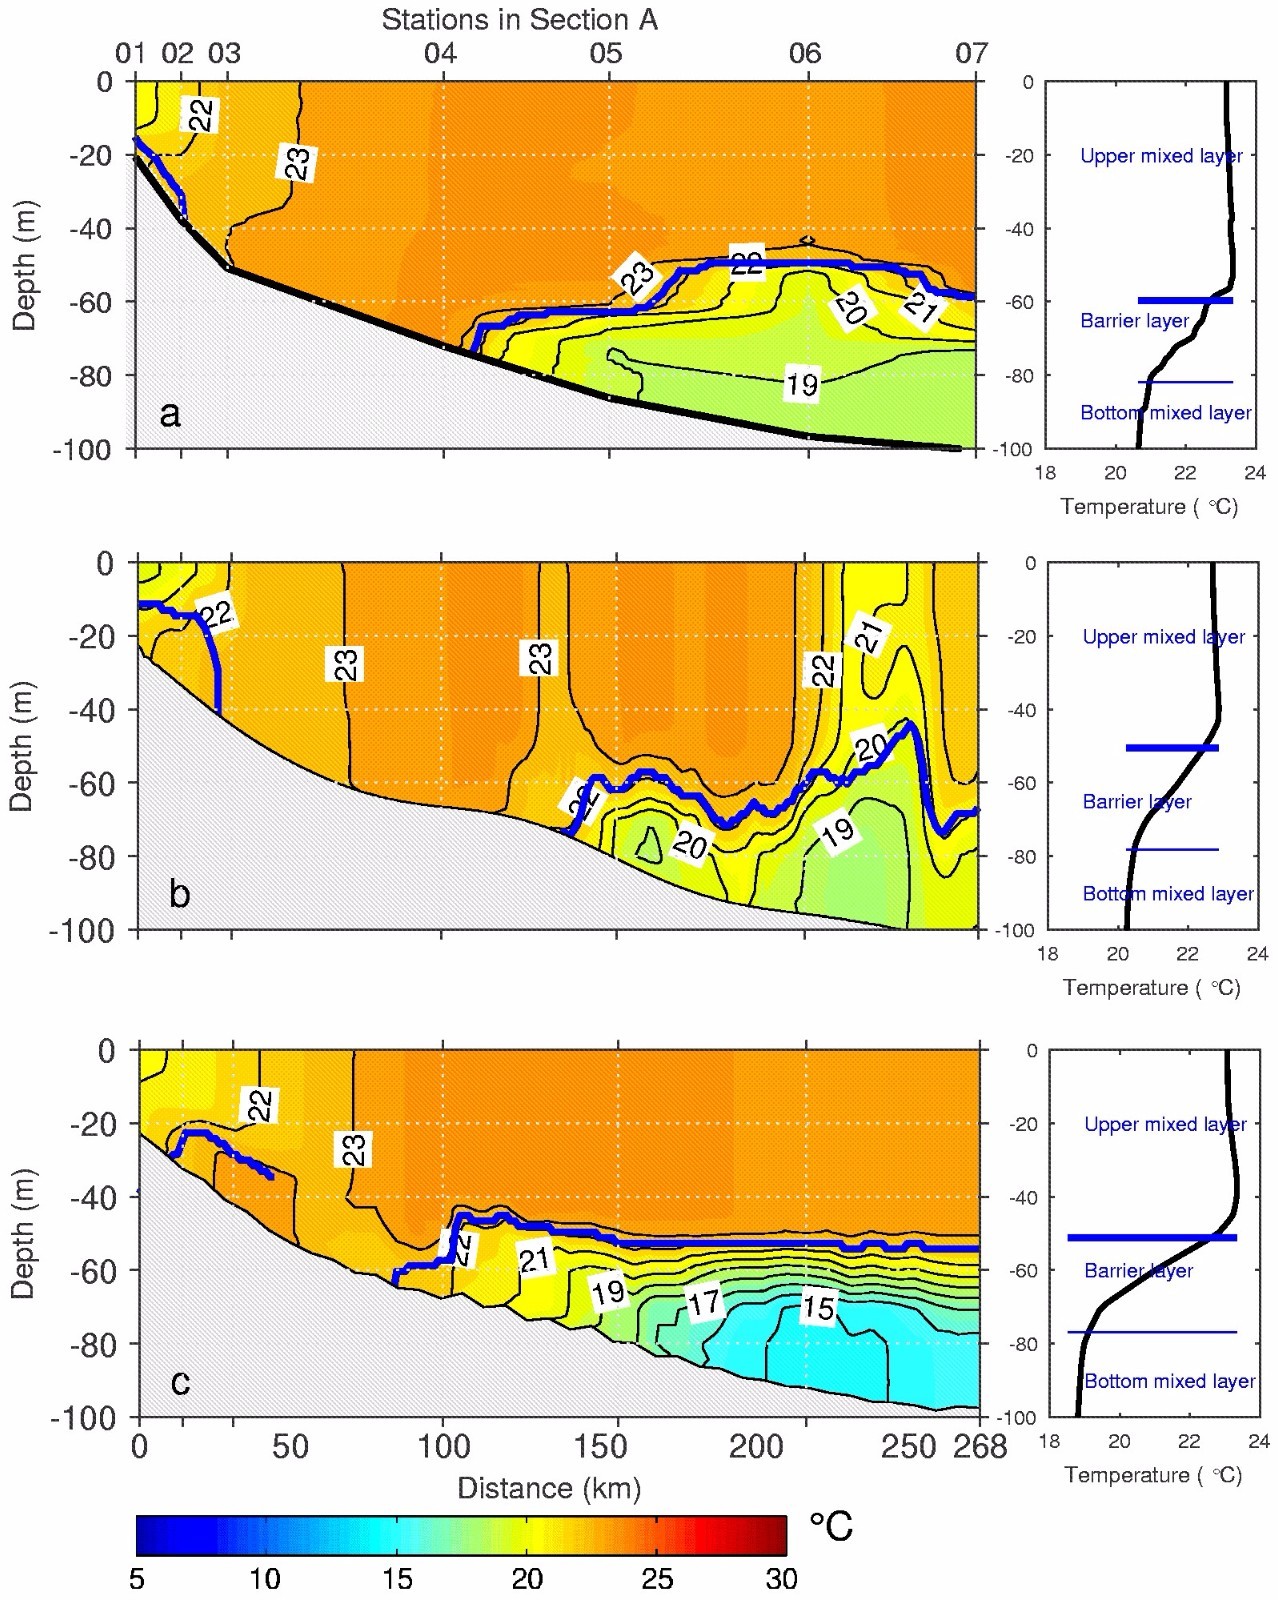
The vertical temperature structure in the section A1–A7 (Fig. 1a) on 2 November, 2013, based on (a) in-situ observations, (b) HRM and (c) LRM. The three panels on the right show the mean structure of the temperature horizontally averaged from the left sections. The thick and thin blue lines show the boundaries between the upper mixed layer, barrier layer and bottom mixed layer.
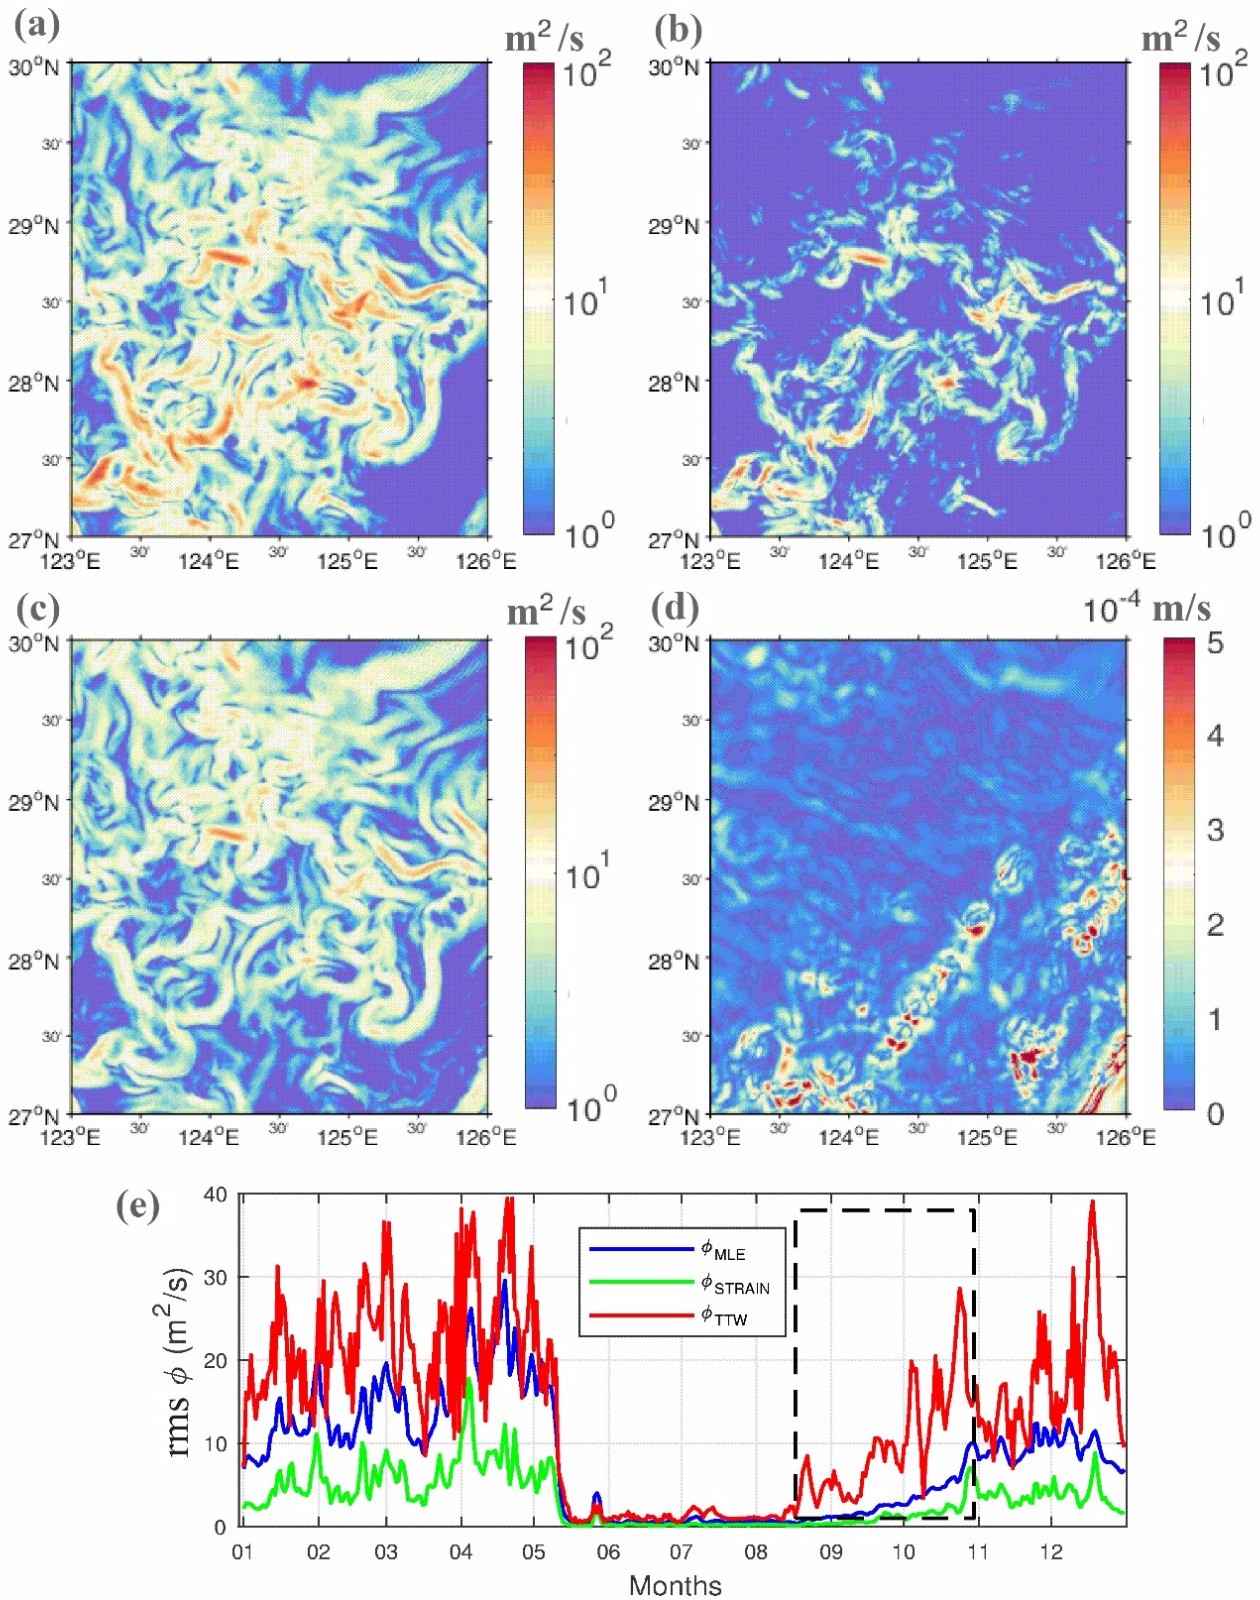
Surface snapshots of (a)ΦMLE, (b)ΦSTRAIN , (c) ΦTTWand (d)ΦWbottom according to Eq. (3) on 2 November, 2013, in the HRM and (e) the corrsponding variations in the stream functions.


