The variability of chlorophyll-a and its relationship with dynamic factors in the basin of the South China Sea
Date of Issue:2022-04-12
Reading:1166
Yu, Y., X. Xing, H. Liu, Y. Yuan, Y. Wang* and F. Chai (2019), The variability of chlorophyll-a and its relationship with dynamic factors in the basin of the South China Sea, Journal of Marine Systems, 200: 103230.
Satellite observations from 2002 to 2017 were used to investigate the spatial distribution and temporal variability of chlorophyll-a (Chl-a) in the South China Sea (SCS). High levels of Chl-a were mostly found near the coasts of China and Vietnam, with a significantly long-term increasing trend. Large seasonal variability was found in the northern SCS and southeast of Vietnam. The Chl-a levels reached the maximum in winter and minimum in summer for majority of the SCS, while the seasonal variability to the southeast of Vietnam was out of phase. The monsoon winds and sea surface temperatures were the most important determinants impacting the distribution and variability of Chl-a along with other associated and influential environmental drivers, e.g., wind stress curl, frontal activity, and sea level anomalies. High correlation coefficients for the seasonal variability between Chl-a and other factors were found in a majority of the SCS, especially in the northern and central parts. The coefficients to the southeast of Vietnam were not valid at seasonal scales, but Chl-a and other factors were significantly correlated at the monthly anomalous fields. This observation occurred because the nutrient supply was mainly determined by local dynamics, e.g., wind-induced coastal upwelling and offshore transport. The interannual variability indicated low levels of Chl-a southeast of Vietnam during El Niño years because of the weakened southwest monsoon. The study offered the first comprehensive description of Chl-a in the SCS at seasonal, anomalous, and interannual variability scales and an analysis of the potential contributing dynamical processes.
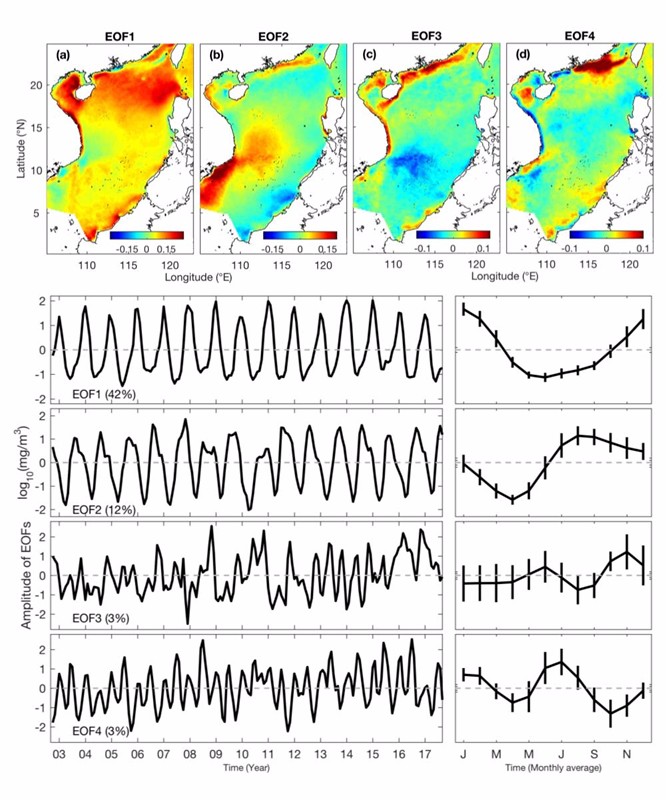
Figure 1 The amplitudes of the first four EOFs for Chl-a levels (top), and the time series (bottom left) and monthly average (bottom right) of the first four EOFs for Chl-a levels. The explained variance was labeled for each mode
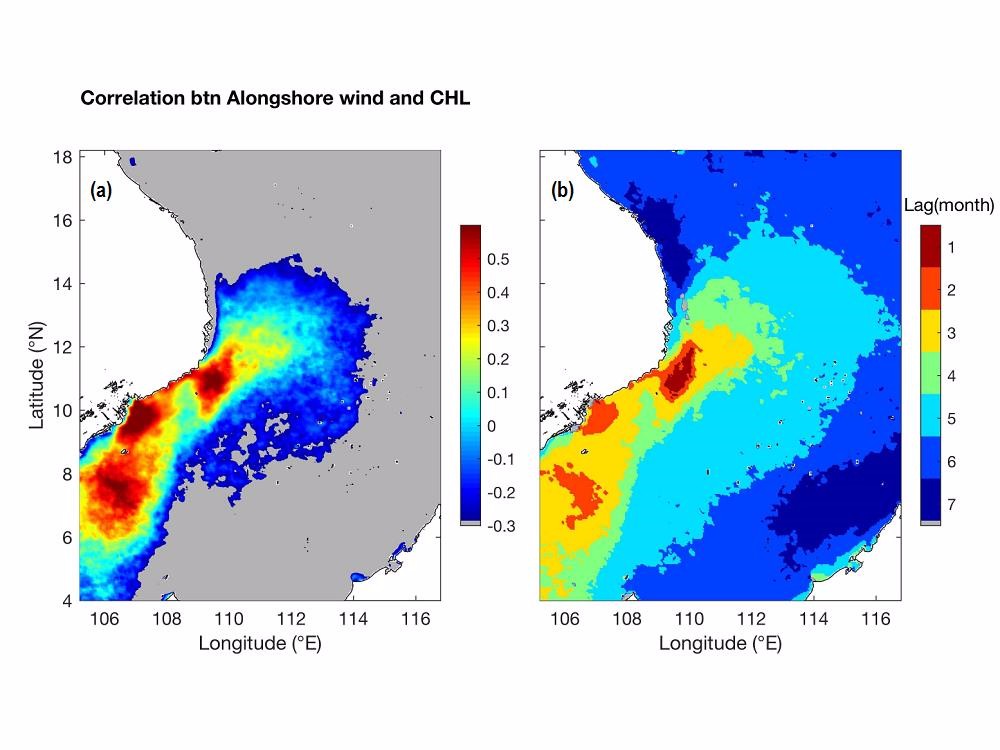
Figure 2 (Left) The correlation coefficient between Chl-a levels and alongshore wind stress with wind leading by one month. Locations with correlations less than -0.3 are plotted in gray. The correlations < 0.21 were not significant. (Right) The lags (wind leading) between Chl-a levels and wind stress when their correlation reached a maximum and significant. Regions where no significant correlations ever existed are plotted in gray


