Satellite estimation of particulate organic carbon flux from Changjiang River to the estuary
Date of Issue:2022-04-12
Reading:1240
Rivers link land and ocean ecosystems, the two largest active carbon reservoirs in the world, and transport tremendous amounts of particulate organic carbon (POC) into marginal seas annually. Due to high spatiotemporal variations, estimations of riverine POC flux into the sea can be relatively inexact when based on field measurement only. In this study, remote sensing algorithms of riverine POC flux through the Xuliujing hydrological station in the Changjiang River Estuary (CRE) were developed using satellite data with hourly resolution from the Geostationary Ocean Color Imager (GOCI). Based on data collected during four seasonal cruises in the CRE from 2014 to 2016, POC concentration showed a significant linear relationship to total suspended matter (TSM) (N = 426, R2 = 0.97, p < 0.01). Thus, surface POC concentration was calculated by satellite-derived TSM. From the in-situ data, the vertical POC concentration profile at Xuliujing showed an exponentially increasing curve (p < 0.01), but a linear decrease (p < 0.01) for the water flow profile from the surface to the bottom. Combining the GOCI-derived surface POC concentration and vertical profiles of POC and water flow, we estimated monthly riverine POC fluxes to the CRE. Results showed that monthly POC flux at Xuliujing (0.071 ± 0.022 Tg C) was 22.64% higher, on average, than the commonly used value at the non-tidal Datong hydrological station. Moreover, under human activity pressures, the influences of POC input from the Changjiang River on POC concentration at Xuliujing have weakened in recent years. Monthly and diurnal POC variations in the CRE were mainly impacted by wind speed and tidal processes, respectively. Thus, satellite monitoring with high spatiotemporal resolution has great significance for accurately estimating riverine POC flux to estuary.
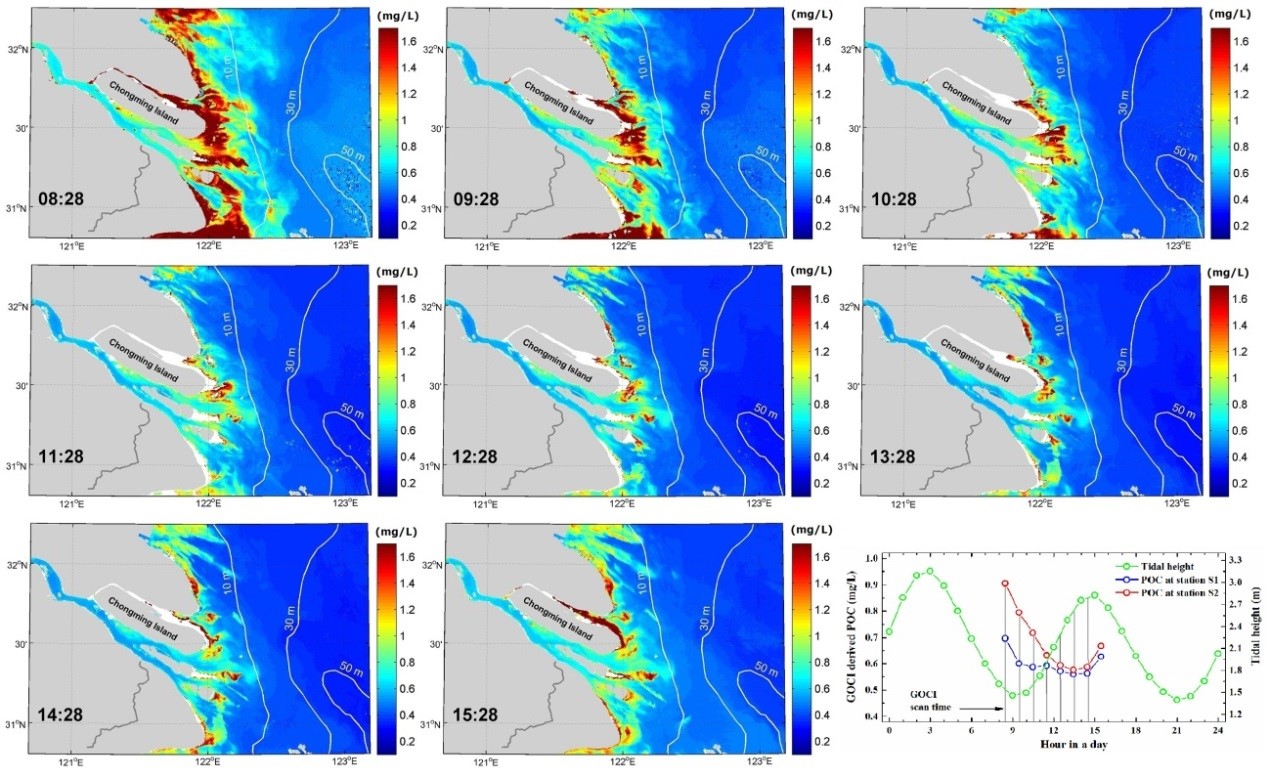
Fig. 1. Hourly surface GOCI-derived POC concentrations on 1 March 2016. Last panel shows 8-h variations of GOCI-derived POC at stations S1 and S2 and their comparisons with diurnal tidal height. Stations S1 and S2 were located at Xuliujing and North Channel outlet, respectively. Tidal height data were from the NMIC/SOA.


