Internal tides in the northwestern South China Sea observed by pressure-recording inverted echo sounders
Date of Issue:2022-04-12
Reading:1187
Zhao, R., X.-H. Zhu, J.-H. Park and Q. Li. Internal tides in the northwestern South China Sea observed by pressure-recording inverted echo sounders. Progress in Oceanography, 2018, 168: 112-122.
This study presents IT observations in the northwestern SCS from five pressure-recording inverted echo sounders (PIESs). The vertical round-trip acoustic travel times that PIESs measures are proportional to the vertical thermocline displacements; therefore, PIESs can be used to monitor the 1st mode internal tides. PIESs were deployed along a section between the continental shelf break in the north and Xisha Islands in the south. Measurements show that both diurnal and semidiurnal ITs were stronger on the northern and southern sides of the section than those in the middle. Their temporal variations were coherent with local surface tides, which implies locally generated ITs may be important. Complex empirical orthogonal function analysis reveals a small phase difference (the south leads the north by 70°) across the section for diurnal ITs, but a significant phase difference (the north leads the south by 360°) for semidiurnal ITs. These observations indicate that the dominant diurnal ITs propagate across the section (from east to west), while the semidiurnal ITs propagate along the section (from north to south). A ray-tracing model was utilized to demonstrate the impact of mesoscale circulation patterns on the propagation of diurnal ITs from the Luzon Strait to the PIES sites. The model explains the temporal IT variations, which were incoherent with local surface tides. The result indicates that diurnal ITs in the northwestern SCS can be affected by ITs propagating from the Luzon Strait, while semidiurnal ITs are primarily generated locally from the continental shelf break in the north.
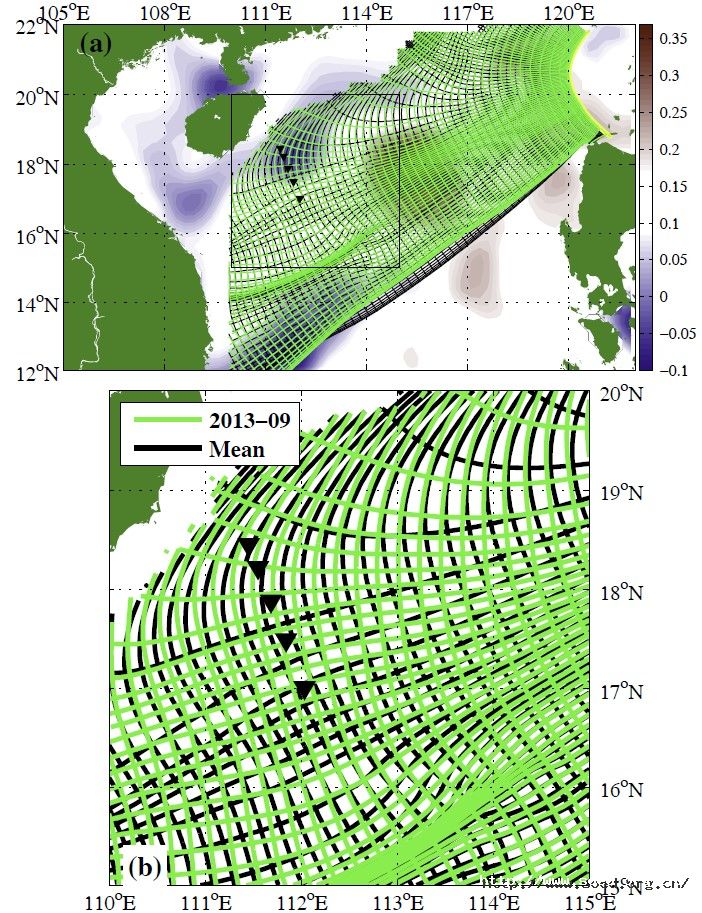
Figure 1. Ray-tracing results for the mode-1 diurnal internal tides radiating from the Luzon Strait for March 2013 (green lines). The black lines are the simulated wave fronts derived from HYCOM output during the observational period. Simulated wave fronts are drawn every 2 h. (a) Ray-tracing results for the SCS. The bold yellow line near the Luzon Strait indicates the initial wave front fitted from a phase contour derived from satellite altimetry by Zhao (2014). Background colored contours show the monthly mean merged sea level anomaly (MSLA) distribution. (b) Enlarged view of the ray-tracing results for the northwestern SCS.


