Tidal currents and Kuroshio transport variations in the Tokara Strait estimated from ferryboat ADCP data
Date of Issue:2022-04-12
Reading:1184
From 2003 to 2011, current surveys, using an acoustic Doppler current profiler (ADCP) mounted on the Ferry Naminoue, were conducted across the Tokara Strait (TkS). Resulting velocity sections (1234) were used to estimate major tidal current constituents in the TkS. The semidiurnal M2 tidal current (maximum amplitude 27 cm s21) was dominant among all the tidal constituents, and the diurnal K1 tidal current (maximum amplitude 21 cm s21) was the largest among all the diurnal tidal constituents. Over the section, the ratios, relative to M2, of averaged amplitudes of M2, S2, N2, K2, K1, O1, P1, and Q1 tidal currents were 1.00:0.44:0.21:0.12:0.56:0.33:0.14:0.10. Tidal currents estimated from the ship-mounted ADCP data were in good agreement with those from the mooring ADCP data. Their root-mean-square difference for the M2 tidal current amplitude was 2.0 cm s21. After removing the tidal currents, the annual-mean of the net volume transport (NVT) through the TkS6its standard derivation was 23.0363.31 Sv (Sv5106 m3 s21). The maximum (minimum) monthly mean NVT occurred in July (November) with 24.60 (21.47) Sv. NVT values from the ship-mounted ADCP were in good agreement with previous geostrophic volume transports calculated from conductivity temperature depth data, but the former showed much finer temporal structure than those from the geostrophic calculation.
Citation:Zhu, X.-H., H. Nakamura, M. Dong, A. Nishina, and T. Yamashiro (2017), Tidal currents and Kuroshio transport variations in the Tokara Strait estimated from ferryboat ADCP data, J. Geophys. Res. Oceans, 122, doi:10.1002/2016JC012329.
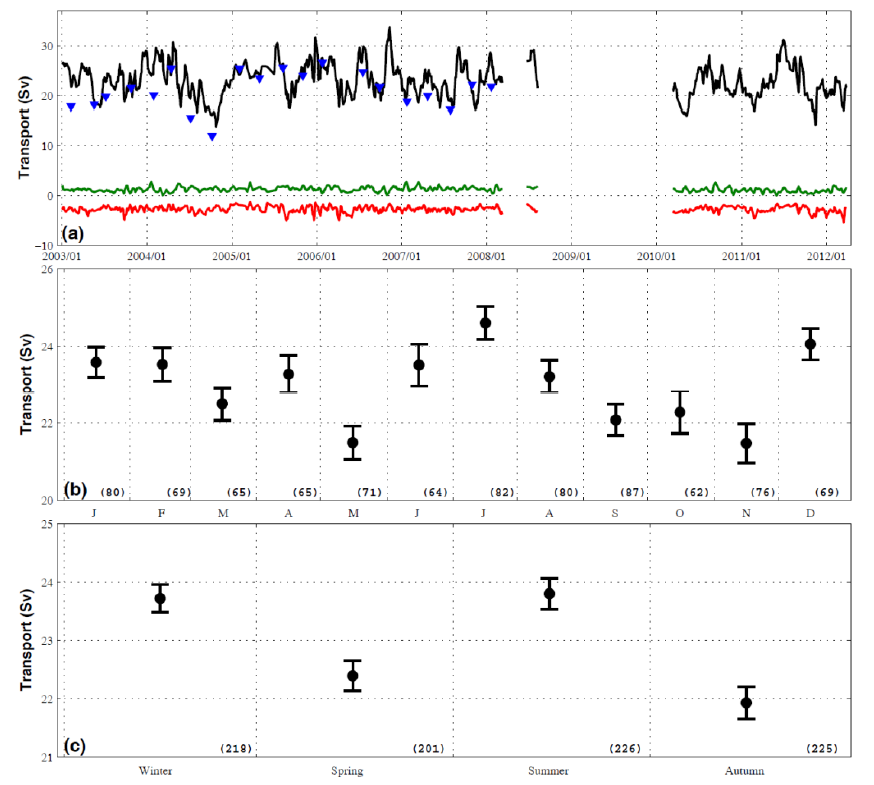
(a)Time series of NVT through the TkS (black line) and the OhS (green line), and (b) monthly and (c) seasonal means for NVT through the TkS. The red line in Figure 13a indicates the westward volume transport through the TkS, and the blue triangles in Figure 13a indicate the geostrophic volume transports estimated using JMA’s CTD data [Wei et al., 2013]. Bars in Figure 13c represent6one standard error of the mean of the volume transport from each month and season. Numbers in parentheses in Figures 13b and 13c indicate numbers of ship-mounted ADCP section data used to calculate the mean and standard deviation for each month and season.


